


Ontario Teachers’ Pension Plan Board posted a fall in its one-year total-fund net return, as its C$62.4bn (€39.5bn) real assets portfolio swung into negative 0.4% for 2025.
Within the real assets portfolio, Ontario Teachers’ C$27.9bn real estate holdings saw losses widen to -3.1%, underperforming its benchmark’s 2.2%. In 2024, real estate recorded -0.7% against the benchmark’s 5%.
The defined benefit Canadian pension plan’s C$34.5bn infrastructure returns fell from a 9.1% return in 2024 to just 1.8% in 2025, below the 7.8% and 8.5% benchmarks for those years.
In the IPE Real Assets Top 150 Real Estate Investors rankings for 2025, Ontario Teachers’ holds the 24th position. The pension fund is ranked ninth in the Top 100 Infrastructure Investors list for 2025.
Within the pension fund’s C$56bn inflation-sensitive portfolio, natural resources recorded a 1.8% return in 2025, outperforming its flat 0.0% benchmark. This follows a 13.3% return in 2024, which fell short of the benchmark’s 15% the same year.
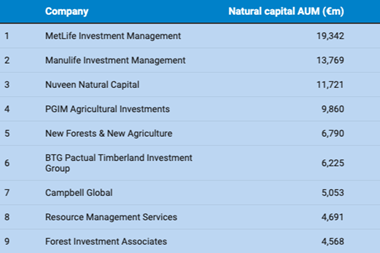
Ontario Teachers’ currently holds the position of the second-largest investor in the IPE Real Assets Top 50 Natural Capital rankings.
The pension fund’s C$12.1bn natural resources portfolio comprises private investments across energy, mining, aquaculture, agriculture, timberland and natural climate solutions.
Overall, Ontario Teachers’ said its one-year total-fund net return was 6.7% for the year ended 31 December 2025, compared to a 9.4% return in 2024.
Jo Taylor, president and CEO, said: “Our private equity and real estate teams had a more challenging year given broad sector headwinds. We responded with disciplined year-end valuation adjustments to reflect current market conditions, which weighed on performance.”
Taylor said the C$279.4bn pension plan underperformed relative to the benchmark return of 11.7% by 5.0%, or $12bn in negative value add.
“The benchmark underperformance was driven by several factors, including continued robust performance in our public market-linked benchmarks, as well as constrained performance of certain assets, particularly the private equity, infrastructure and real estate asset classes,” Taylor added.
| Asset Class | 2025 Actual (%) | 2025 Benchmark (%) | 2025 AUM (C$bn) | Portfolio Mix (%) | IPE Global Ranking | Ranking Category |
|---|---|---|---|---|---|---|
| Total Fund (Net) | 6.70% | 11.70% | $272.6bn | 100% | — | — |
| REAL ASSETS (Total) | -0.40% | 5.30% | $62.4bn | 23% | — | — |
| Real Estate | -3.10% | 2.20% | $27.9bn | 10% | 24th | Top 150 Real Estate |
| Infrastructure | 1.80% | 7.80% | $34.5bn | 13% | 9th | Top 100 Infrastructure |
| NATURAL RESOURCES | 1.80% | 0.00% | $12.1bn | 4% | 2nd | Top 50 Natural Capital |
To read the latest IPE Real Assets magazine click here.